
18th December 2025
Align & Prioritise : IntentOS Stage 2
Getting the board, the CEO and every team behind one plan and one number
This is the second article in a series of three that explains the IntentOS framework and the stages within it:
- Article 1 – Strategic Clarity
- This article – Align & Prioritise
- Article 3 – Decision Velocity
Strategic Clarity gives you the map. Stage 2 is where you decide what to do about it, and where you get everyone pulling the same way. That second part is the hard bit, and it’s the one most marketing functions never crack.
Ask around and the problem isn’t data. Most teams are drowning in it. The problem is agreement. Budgets get set channel by channel. Agencies get briefed separately, each from their own version of the market. The board sees a set of numbers the marketing team doesn’t recognise, and the marketing team reports numbers the board can’t use. “Alignment” turns out to mean a kick-off meeting in January and a shared drive nobody opens.
Stage 2 fixes that with three things inside the platform: a strategy set where the work happens, opportunities scored against real demand and real brand fit, and one measure that the board, the CEO and every piece of work answers to.
Set the strategy once, where the work happens
Most marketing strategies live in a deck that gets opened twice a year. In IntentOS the strategy lives in the platform. The Strategy Setter captures what you’re trying to achieve, which customers and which parts of the market matter most, and what you’re deliberately not doing.
That matters because the strategy is a working filter, not a document. Every opportunity and every recommendation the platform surfaces has to justify itself against the objectives you’ve set. If a piece of activity doesn’t serve the strategy, it doesn’t make the plan, however tempting the traffic looks. One objective, written down where the work is, that everything has to feed.
It’s also how the budget arguments end. When leadership, channel teams and agencies are all looking at the same objectives, prioritising becomes a comparison against a shared goal rather than a negotiation between departments about who shouted loudest last quarter.
Opportunities, scored like a strategic planner
The Market Map from Stage 1 shows you the full picture of demand in your category. Stage 2 turns it into Opportunities: specific, named places where your brand can win.
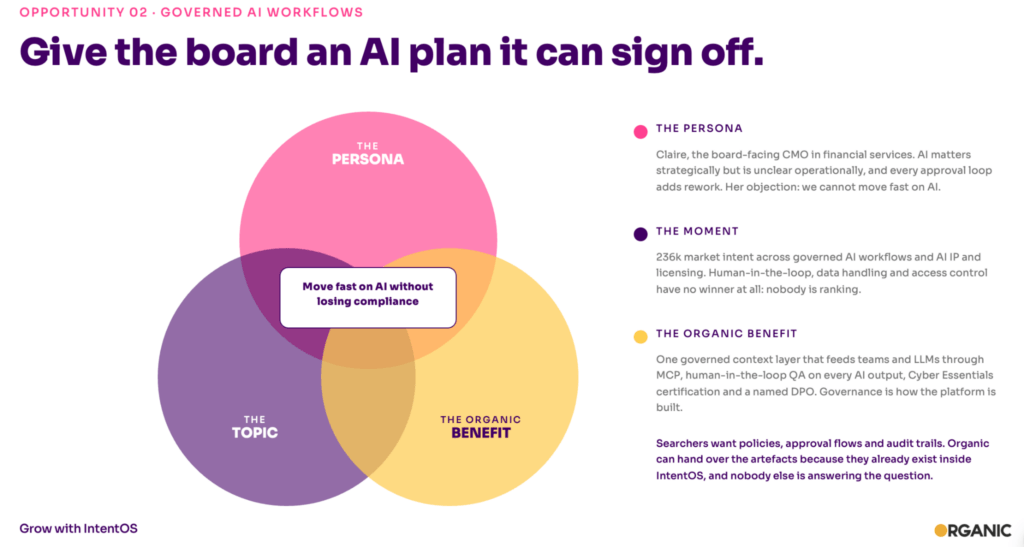
Each one is scored on the overlap of three things. Draw it as a Venn diagram:
- Persona need. A real customer with a real job to be done, expressed in their language rather than a keyword list.
- Moment and demand. Enough live intent, right now, to be worth the effort, with momentum that tells you where it’s heading.
- Brand promise/ Product benefit. A benefit you can credibly claim: your product, your value, your USP.
The opportunities worth acting on sit where all three overlap. Two out of three is where marketing usually goes wrong. Demand with no persona need is traffic-chasing. A need your product can’t serve is a competitor’s opportunity. A promise nobody is searching for is a press release.
Each opportunity then carries Recommendations: the specific actions to take, whether that’s content, SEO, paid, UX or something more structural, ranked by score and filtered against your strategy. The scoring blends the evidence in the Map with expert judgement, so it isn’t automated guesswork. It’s a defensible answer to “why are we doing this first?”, which is a question most marketing teams currently answer with a shrug.
One number the board can get behind
Here’s why marketing keeps losing the budget conversation. It turns up with a different number for every channel, none of which the CFO recognises, and all of which describe what already happened. Search reports rankings, paid reports ROAS, social reports engagement, and the board is asked to add them up.
Share of Intent is the single measure that replaces all of that at the strategic level. It’s the share of your market’s live demand that your brand is winning, across every channel where that demand shows up. Because intent forms before purchase, it’s a forward indicator: it tells you where your market share is heading, not where it’s been. We’ve written up how Share of Intent works in full, so this piece is about what it does to the way you run marketing.
What it does is give you something to agree on. The board and the CEO sign up to one objective and one measure, once. The plan is built to move it. The budget is agreed against it. From then on every task, every agency and every pound has to show how it feeds that number, and if it can’t, it doesn’t count. That’s not a slogan. It’s how the platform works: every task traces back to an opportunity, every opportunity to the strategy, and every result to its effect on Share of Intent.
The knock-on effect is the alignment everyone talks about and nobody achieves. People, budget and agencies line up behind one thing because there’s only one thing to line up behind. Channel teams stop defending their own scorecard. Agencies get briefed from the same map as the in-house team, against the same measure. And when the CFO asks what marketing did this quarter, the answer is one number and which way it moved, in a currency finance already understands.
What comes next: Decision Velocity
Stage 2 is the bridge between knowing your market and doing something about it. A strategy set where the work happens, opportunities scored against real demand and real brand fit, and one measure the whole business has agreed to move.
Stage 3 is where it ships, where you find out how long shipping actually takes, and where the results feed back into the system so it gets better at telling you what to do next.